Circle_cos_sin.gif(650 × 390 pixel, dimensione del file: 517 KB, tipo MIME: image/gif, ciclico, 60 frame, 6,0 s)

Questo file proviene da Wikimedia Commons, per ulteriori informazioni vedi la sua pagina di descrizione.
Se non hai mai usato Commons, visita la pagina di benvenuto, o leggi le FAQ.
Visualizza quali progetti usano questa immagine.

Dettagli

Descrizione
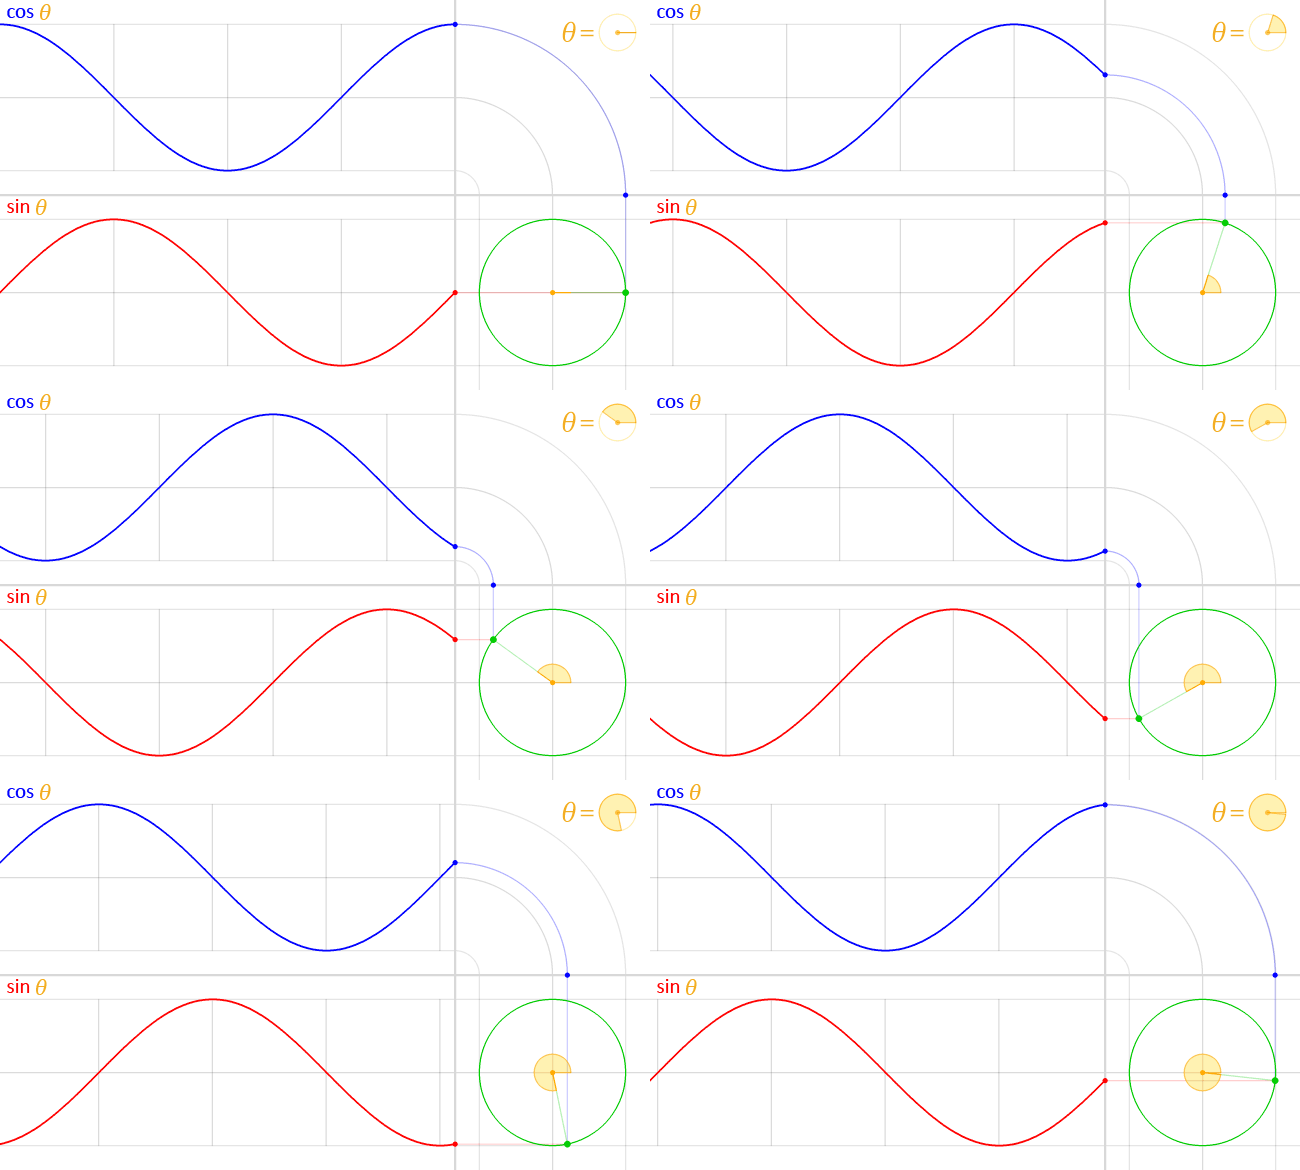
English: We have the unit circle (with radius = 1) in green, placed at the origin at the bottom right.

In the middle of this circle, in yellow, is represented the angle theta (θ). This angle is the amount of counter-clockwise rotation around the circle starting from the right, on the x-axis, as illustrated. An exact copy of this little angle is shown at the top right, as a visual illustration of the definition of θ.

At this angle, and starting at the origin, a (faint) green line is traced outwards, radially. This line intersects the unit circle at a single point, which is the green point spinning around at a constant rate as the angle θ changes, also at a constant rate.

The vertical position of this point is projected straight (along the faint red line) onto the graph on the left of the circle. This results in the red point. The y-coordinate of this red point (the same as the y-coordinate of the green point) is the value of the sine function evaluated at the angle θ, that is:

y coordinate of green point = sin θ

As the angle θ changes, the red point moves up and down, tracing the red graph. This is the graph for the sine function. The faint vertical lines seen passing to the left are marking every quadrant along the circle, that is, at every angle of 90° or π/2 radians. Notice how the sine curve goes from 1, to zero, to -1, then back to zero, at exactly these lines. This is reflecting the fact sin(0) = 0, sin(π/2) =1, sin(π) = 0 and sin(3π/ 2) -1

A similar process is done with the x-coordinate of the green point. However, since the x-coordinate is tilted from the usual convention to plot graphs (where y = f(x), with y vertical and x horizontal), an “untilt” operation was performed in order to repeat the process again in the same orientation, instead of vertically. This was represented by a “bend”, seen on the top right.

Again, the green point is projected upwards (along the faint blue line) and this “bent” projection ends up in the top graph’s rightmost edge, at the blue point. The y-coordinate of this blue point (which, due to the “bend” in the projection, is the same as the x-coordinate of the green point) is the value of the cosine function evaluated at the angle θ, that is:

x coordinate of green point = cos θ
The blue curve traced by this point, as it moves up and down with changing θ, is the the graph of the cosine function. Notice again how it behaves at it crosses every quadrant, reflecting the fact cos(0) = 1, cos(π/2) = 0, cos(π) = -1 and cos(3π/2) = 0.
Data
Fonte Opera propria
Autore Lucas Vieira
Licenza
(Riusare questo file)
Public domain Io, detentore del copyright su quest'opera, la rilascio nel pubblico dominio. Questa norma si applica in tutto il mondo.
In alcuni paesi questo potrebbe non essere legalmente possibile. In tal caso:
Garantisco a chiunque il diritto di utilizzare quest'opera per qualsiasi scopo, senza alcuna condizione, a meno che tali condizioni siano richieste dalla legge.

Didascalie

Aggiungi una brevissima spiegazione di ciò che questo file rappresenta

Elementi ritratti in questo file

raffigura

image/gif

c06fd6a5f798c5ac8eb37784d218a2f190916f4d

529 197 byte

5,999999999999995 secondo

390 pixel

650 pixel

Cronologia del file

Fare clic su un gruppo data/ora per vedere il file come si presentava nel momento indicato.

Data/OraMiniaturaDimensioniUtenteCommento
attuale02:32, 24 giu 2014Miniatura della versione delle 02:32, 24 giu 2014650 × 390 (517 KB)LucasVBReverted to version as of 15:59, 16 March 2014
01:00, 23 giu 2014Miniatura della versione delle 01:00, 23 giu 2014390 × 650 (390 KB)SteinsplitterBotBot: Image rotated by 90°
17:59, 16 mar 2014Miniatura della versione delle 17:59, 16 mar 2014650 × 390 (517 KB)LucasVB{{Information |Description ={{en|1=sin & cos}} |Source ={{own}} |Author =LucasVB |Date =2014-03-16 |Permission ={{PD-self}} |other_versions = }} Category:Trigonometry [[Category:Trigonometric funct...

La seguente pagina usa questo file:

Utilizzo globale del file

Anche i seguenti wiki usano questo file: